
Building AppsFlyer’s predictive analytics solution


In an age when privacy is a marketer’s greatest concern, the future belongs to predictive analytics.
The future is now.
AppsFlyer has been working on a predictive analytics solution since late 2019, long before privacy became such a burning topic.
The introduction of predictive insights into the average app developer’s tech stack can offer AppsFlyer’s customers an unprecedented competitive advantage, as well as enhance many of AppsFlyer’s products, from Incrementality to fraud protection.
The first step in implementing such insights was carried through campaign lifetime value (LTV) predictions – estimating the future value of a campaign early into its runtime, and eliminating the unnecessary waiting period before results come in.
Defining the lifetime value (LTV) matrix
Each campaign’s LTV is usually determined in the weeks following an app install, whereas UA decisions are only made in present time and given current information. This means that any decision, at any point in time, will carry some degree of LTV uncertainty.
The average UA manager could launch a campaign, and wait for initial user LTV data to come in prior to making optimization decisions. This could take up to 30 days or in many cases, longer. Using advanced BI and analytics tools can reduce this period to 10-15 days.
However, 10-15 days is still a lot. Our goal was to eliminate this waiting period (the “uncertainty period”) during which campaigns could bleed money while waiting for results. To do so we set the ambitious goal of providing predictive user LTV insights for day 30 based on the first 24 hours of user engagement.
But how can one LTV formula be applied to the endless variety of LTV calculations AppsFlyer’s customers use?
After conducting thorough market research, our team narrowed down the possibilities to three main pillars that encapsulate the key decision-making LTV aspects in user acquisition activity:
- Retention: measuring how long a user is expected to use the app
- Engagement: analyzing a user’s level of engagement with the app environment
- Monetization: scoring a user’s revenue-generating potential through ads, purchases, and more
Each of the above pillars is measured on different scales so we must first normalize them. To do so we decided to apply a relative scoring system that associates each pillar with a unique predicted score ranging from 1-9.
Additionally, a key factor to consider is campaign cost, and therefore measure a user’s LTV relative to the cost of user acquisition. Even though a cost prediction is not required because it’s a fixed figure, it still needs a score in order to fit the normalized scoring system.
Get the latest marketing news and expert insights delivered to your inbox
Creating a solution around available assets
Now was time to start exploring the available data and identifying the right data points that can be made into machine learning labels and features.
We realized that regardless of the approach we used, we would have to encompass a multi-tenant design, i.e. a solution that would accommodate as many of AppsFlyer’s customers as possible despite inherent differences in vertical, usage, popularity, and business models.
We initially focused on data points that were widely available across all AppsFlyer customers. Key factors such as recency, frequency of use, in-app purchases, and in-app advertising revenue were the “obvious” components with any app’s monetization logic.
AppsFlyer in-app events are an excellent example for such data points, as all customers are encouraged to utilize them in one way or another.
With in-app events, AppsFlyer has always provided its customers with flexibility – both in timing (when an event should be triggered / following which actions), and in content event names or any other parameters that are worth reporting.
On the one hand, this means that app owners can tailor these in-app events to match their own specific needs, providing valuable and relevant insights on their ecosystem.
On the other hand, some of this information cannot be turned into a machine learning feature or label, at least not without a mediation layer that would translate the information that an in-app event carries into the corresponding LTV component category.
We decided to tackle this problem from both angles and built a process that analyzes historic customer event data and determines the probabilistic “hierarchy” of events.
In parallel, we recommend our customers to map events to the corresponding categories based on the importance of these events to their LTV logic.
The combination of these methods gave us the insight to make use of historical customer data and create our machine learning training datasets.
Process validation
Once we were able to validate with our design partners that the data points we chose were optimal to best describe the user’s LTV, we were able to proceed to inspect their distribution within our selected dataset. The distribution of features or targets within the dataset has great significance for accurate machine learning.
Working with a sparse dataset, where almost all “targets” are distributed around the same point, won’t yield great results. For example, if an app developer only reports progress-level when a user reaches level 500, but in-fact 99.9% of all app users will never reach that level, we will end up with a distribution of features/targets that can’t be used for our engagement prediction.
This is a crucial decision point in the onboarding process of any app – if it doesn’t make significant use of AppsFlyer (dispatching in-app events, providing purchase information, and ad-revenue events, etc.), we will not be able to create a prediction model that is reliable and sufficiently accurate. A customer must therefore make the most of AppsFlyer’s capabilities prior to onboarding.
After ensuring that the process we created for transforming raw customer data into the LTV components that we wish to predict is working well (for eligible apps), we focused on assuring that the scoring system is the right one – that it accurately describes the data analyzed (in terms of standard-deviation and distribution), and can be most beneficial to our customers who need to make UA decisions with clarity and confidence.
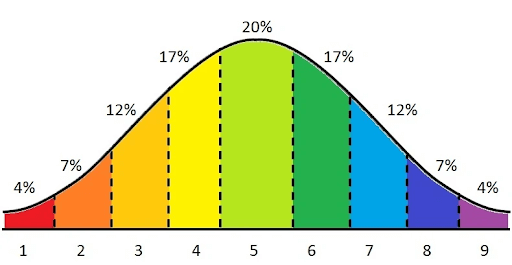
We chose to implement Stanine scoring with scores in the scale of 1-9. It’s convenient both in its score differences (not too small so the difference is meaningless, and not too large so it reflects major differences between campaigns), and it’s standard distribution of two, which allows easy calculation of a campaign percentile.
In some cases, when data distribution was not “perfectly normal” but did resemble normal distribution, we made use of Box Cox transformations to redistribute the target population to a distribution that is closer to normal.
The time-series nature of LTV drove our hypothesis that an RNN based solution could probably yield the best results. After some testing and investigation we decided to use Tensorflow as the machine learning framework and started developing our algorithm using the Keras.Sequential API, later moving to the Functional API which allowed more flexibility; however, it was more complex.
Let’s take a deeper look into the process of putting together all the pieces that made such a solution possible.
Product construction
We decided to build our production system utilizing Amazon SageMaker for real-time inference. Amazon SageMaker provides a multi-tenant, real-time endpoint solution, which could be customized to work with various ML frameworks and supports custom algorithms like the one we developed.
“This is a great example of how Amazon SageMaker can be used to simplify and expedite the development of machine learning-based products at scale. Amazon SageMaker provided AppsFlyer the flexibility to bring their own proprietary ML algorithms and still enjoy the advantages of a managed service. SageMaker is used to train, optimize and deploy multiple machine learning models in a scalable, automated and cost-effective manner. Furthermore, due to the use of Multi-Model Endpoints, AppsFlyer was able to reduce the burden of orchestrating multiple models deployment and updates by simply copying them to S3.”
Orit Alul and Chaitanya Hazarey, AWS Solutions Architects
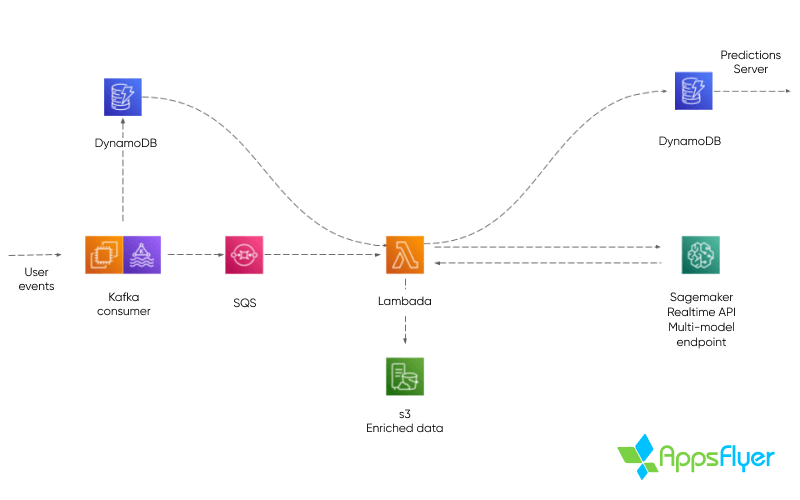
We also decided to utilize AWS managed services, such as AWS Lambda, Amazon SQS, and AWS DynamoDB in order to speed up the development process, while continuing to gain the scalability and stability that our product required.
The production system ingests real-time events from client SDKs, arriving via Apache Spark cluster topics. Event data and user metadata is stored in DynamoDB tables and a decision process is performed per each consumed event.
If an inference occurs after the current event, when an inference is decided on, the “predicted” user’s metadata is dispatched to a Lambda function via SQS. The event data is then loaded within the Lambda function, transformed for ML and is sent to SageMaker for inference. Once a result is received it is stored in another DynamoDB table.
This process generates user scores that can be requested by the client’s SDK as SKAdNetwork conversion values at any given time, and are frequently-updated over time to maximize the accuracy of predictions.
Model training
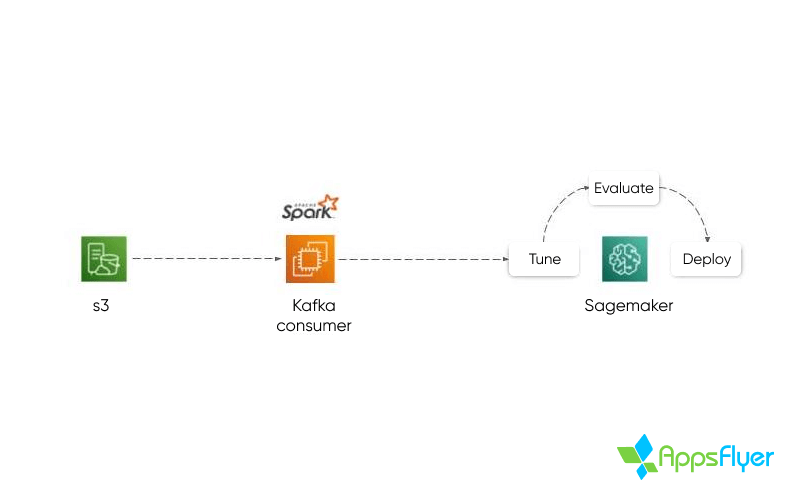
Prior to onboarding a new app to Predict, a training period is required where all of the app’s historical first-party data is analyzed and reviewed using Amazon SageMaker. The process is meant to identify and model different types of correlations, and will be reiterated until satisfactory model accuracy levels are achieved.
The model accuracy is reviewed using multiple statistics; MAE – the mean absolute error of the model (per category), RMSE – the root mean square error, and Cohen’s Kappa to ensure validity and integrity of the model.
Necessary adjustments are made on the model by introducing additional data points, modifying specific events’ relative weights, and labels. This is all in an attempt to perfect the model prior to launch.
Once onboarding is complete and the campaigns launch, new users will start downloading and engaging with the app, generating new data through the AppsFlyer SDK.
Predict calculates a user’s benefit score based on the three pillars of Engagement, Retention, and Monetization. This benefit score is compared to the campaign cost to provide a comprehensive, actionable score.
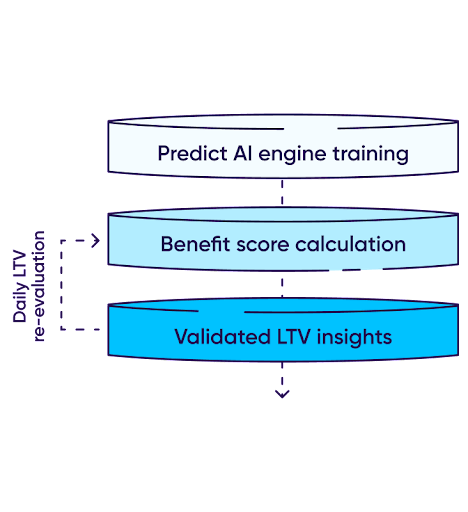
The score re-evaluation process is consistently repeated during the user’s measurement window (usually 24 hours) with the goal of producing an accurate predictive score.
As with other AppsFlyer products, AWS’s infrastructure allows us to operate this complex operation at scale, and products like Amazon SageMaker permits us to operate it in a multitenant form that enables us to create, and operate unique predictive models across different apps and developers in a siloed manner.
Predictive analytics not only provide us a significant competitive advantage through the ability to foresee what’s up ahead, it also provides a significant leap forward in terms of the way we optimize and market our products.
No longer does it matter who the user is, but only what their behavior can tell us.